Inbound damage reporting: which carrier, plant and lane brings you the damage
Receivers document each load in the CargoLens app. The Inbound Damage Report turns those records into damage rates by carrier, origin, lane, site, SKU and batch, with every number one click away from the photos behind it.

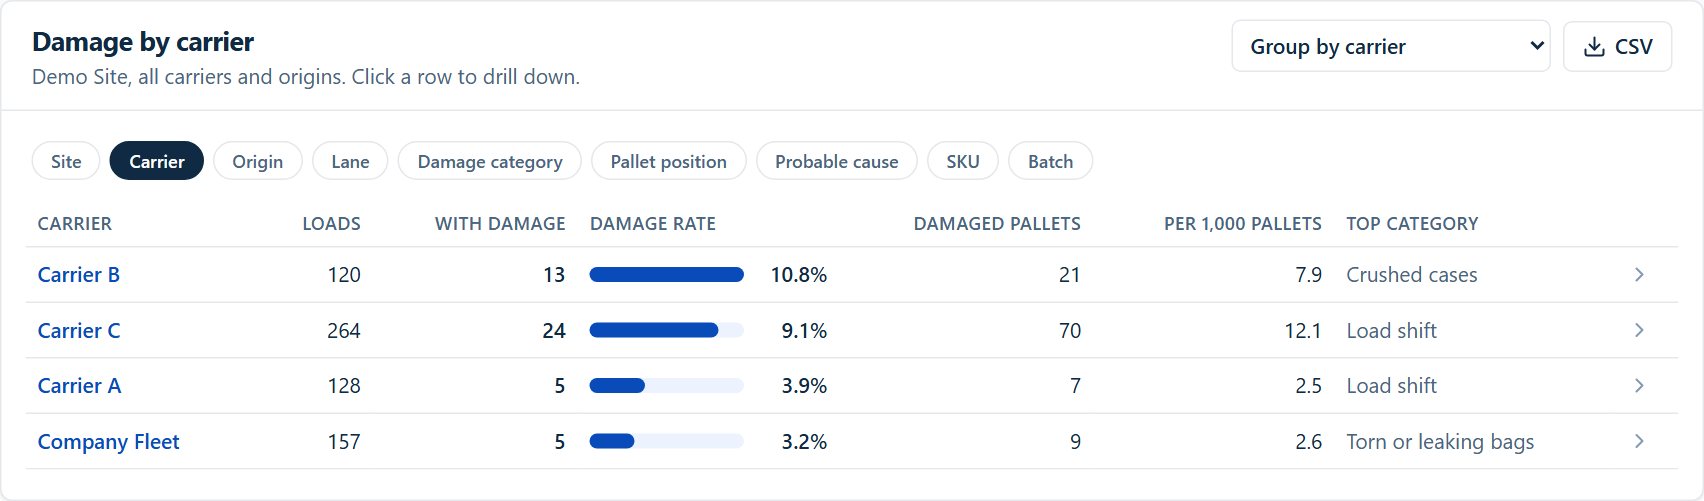
The inbound damage metrics that matter
Five numbers answer most carrier and plant reviews. This is how each one is worked out in the report, so you can compare it with what you track today.
How often a truck arrives with a problem. The headline number for a carrier or plant review.
Normalizes for volume, so a carrier that brings five times the freight is compared fairly.
The damage that cost you inventory, not just rework.
Load shift points at loading and securement; crushed cases at stacking or packaging.
Claims and notices still waiting on someone.
| Metric | How it is calculated | What it tells you |
|---|---|---|
| Loads with damage | loads with at least one damaged pallet ÷ inbound loads | How often a truck arrives with a problem. The headline number for a carrier or plant review. |
| Damaged pallets per 1,000 received | damaged pallets ÷ pallets received × 1,000 | Normalizes for volume, so a carrier that brings five times the freight is compared fairly. |
| Rejected pallets | pallets rejected at receiving | The damage that cost you inventory, not just rework. |
| Top damage category | most common category, as a share of damaged loads | Load shift points at loading and securement; crushed cases at stacking or packaging. |
| Open follow-ups | damaged loads not yet resolved | Claims and notices still waiting on someone. |
Volume matters: a carrier with a high damage rate on a handful of loads needs more loads before you act. The report shows the load count next to every rate.
Not just carrier blame: damage by origin
Plenty of damage leaves the plant already there: poor wrap, weak pallets, a stacking pattern that shifts. Group by origin to see which plant or supplier ships it, then by SKU and batch to see which product and production run.
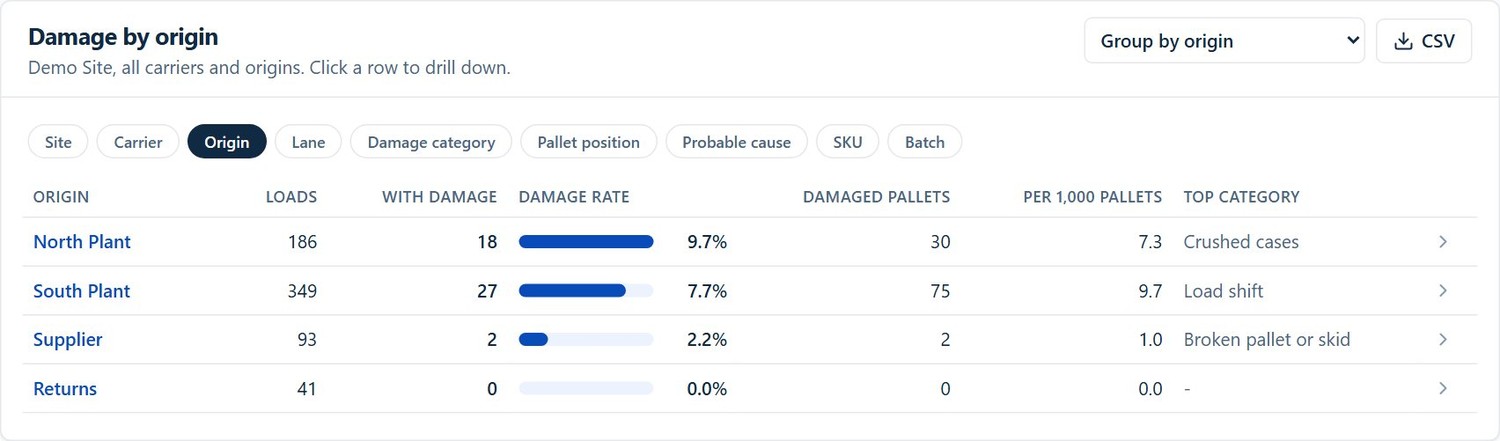
More on product-level tracking: damage by SKU and batch.
Get the numbers where they are used
Drill down to the photo
Click any carrier, plant or SKU to list the loads behind it, then open a load for its photos, AI flag, issue lines and signatures.
Weekly plant email
Turn on a weekly email per origin plant: last week’s damaged issue lines with SKU, batch, quantity, carrier and photo links, plus a CSV.
CSV, Excel and PDF
Export the loads in view as CSV, the report as Excel, or a PDF for the period. Each inspection also exports as a PDF claims packet.
The report is only as good as the receiving record behind it. See how receivers capture it in the receiving inspection app and the OS&D app.
Published pricing, per site
Every receiver, lead and manager at a site is included. No per-seat fees.
Pro
Unlimited users and inspections, AI damage flags, AI paperwork reading, custom workflows, reports and claims packets. $749 month to month.
Book a 15-min demoCommon questions
What is inbound damage reporting?
Inbound damage reporting rolls up what receivers find on every inbound load into numbers you can act on: how often loads arrive damaged, how many pallets, which carriers, plants, lanes and products are behind it, and which claims are still open. It turns single OS&D reports into a pattern.
Where does the data come from?
From the receiving inspections your team already does in the CargoLens app. Each inspection records the carrier, origin, pallets, damage, issue lines with SKU, batch and quantity, and the decision. The Inbound Damage Report reads those records, so there is nothing to retype.
Which ways can I group the report?
By site, carrier, origin (such as a plant or supplier), lane, damage category, pallet position, probable cause, SKU and batch. Click any row to see the loads behind it and open each record.
Can the report be emailed every week?
Yes. Each organization can turn on a weekly email per origin plant. It lists the damaged issue lines received in the past week with SKU, batch, quantity, issue, carrier and receiving site, with photo links and a CSV attached.
Can I export the numbers?
Yes. Export the loads in view as CSV, the report as Excel, or a PDF of the report for the period. Every grouping has its own CSV export too.
How is this different from WMS damage codes?
A WMS usually stores a reason code against a receipt line. CargoLens keeps the evidence behind it: photos, the AI flag and the receiver’s decision, signatures, where on the trailer the damage was, and the carrier and origin. That is what a carrier review or claim needs. Integration with your WMS or ERP is part of setup, and there is a public REST API.
CargoLens at a glance
- What it is
- CargoLens is a dock inspection app with AI damage detection on photos. Receivers document each load on a phone or tablet (iOS and Android), and managers review records, reports and exports in a web portal.
- Who it is for
- Receiving and shipping teams at warehouses, distribution centers, 3PLs, cross-docks and manufacturers that receive goods from their own plants.
- Key capabilities
- AI damage detection: AI flags visible damage in each photo and the receiver confirms or clears it (Pro, needs a connection)
- Issue lines on each load with SKU, batch, quantity, the issue and photos
- Reports by origin plant, carrier, site, SKU and batch, plus a weekly plant report email
- Container number, seal number and license plate capture, with an ISO 6346 check on container numbers
- OCR with AI: reads BOLs, packing slips, container numbers, seals and plates from photos into fields the user confirms (Pro, needs a connection)
- Offline capture at the dock, with automatic sync when the connection returns
- App in English and Spanish
- Public REST API and signed webhooks
- CSV, Excel and PDF exports, including a PDF claims packet per inspection
- Unlimited users on paid plans: priced per site, not per seat
- Pricing
- Free: 50 inspections a month, 2 users, no credit card. Pro: $599 per site per month billed annually, or $749 month to month, unlimited users. One-site 30-day pilot: $2,500, credited in full to year one. All plans
- Company
- CargoLens by Sentria Inc., Puyallup, Washington, USA.
- Not to be confused with
- CargoLens (cargolens.app) is the dock inspection app by Sentria Inc. It is not affiliated with other companies or products that use a similar name.
More guides for receiving teams
OS&D app
Record over, short and damaged freight at the door, with a free OS&D form template.
Read the guideReceiving inspection app
A guided check for every inbound load, with a free receiving inspection checklist.
Read the guideDamage by SKU and batch
Issue lines with SKU, batch and quantity, and reports that trace damage to the line.
Read the guideOpen the Inbound Damage Report yourself
The live demo is read-only sample data: click through every grouping and drill down to the photos. Or book 15 minutes and we will set it up for your carriers and plants.